The Office of Rail & Road Station Usage Report has been released which of course makes me unreasonably excited. The report details the estimated* usage of every station on the UK rail network.
*Estimated because not all stations on the UK network are gated and therefore do not provide a 100% accurate reading of passenger usage. Usage is also estimated where stations are grouped together as a single destination (e.g Manchester All, Liverpool All, London Zone 2). For more information on this click here.
So let’s start by looking at the UK’s most and least used stations. For all the stats I’m using in this review I’m going to be focusing on Combined Entry & Exit data. ‘1 Passenger’ is defined as a journey starting or ending at any given station.
Most Used
|
Station |
Region |
Passengers |
| 1 (=0) |
London Waterloo |
London |
99,201,604 |
| 2 (=0) |
London Victoria |
London |
85,337,996 |
| 3 (=0) |
London Liverpool Street |
London |
63,631,246 |
| 4 (=0) |
London Bridge |
London |
49,517,854 |
| 5 (+1) |
London Charing Cross |
London |
42,978,890 |
| 6 (-1) |
London Euston |
London |
42,952,298 |
| 7 (=0) |
London Paddington |
London |
35,724,648 |
| 8 (=0) |
Birmingham New Street |
West Midlands |
35,312,788 |
| 9 (=0) |
London King’s Cross |
London |
31,346,862 |
| 10 (+2) |
Stratford |
London |
30,974,204 |
No surprises really that 9 out of the 10 busiest stations in the UK are in London.
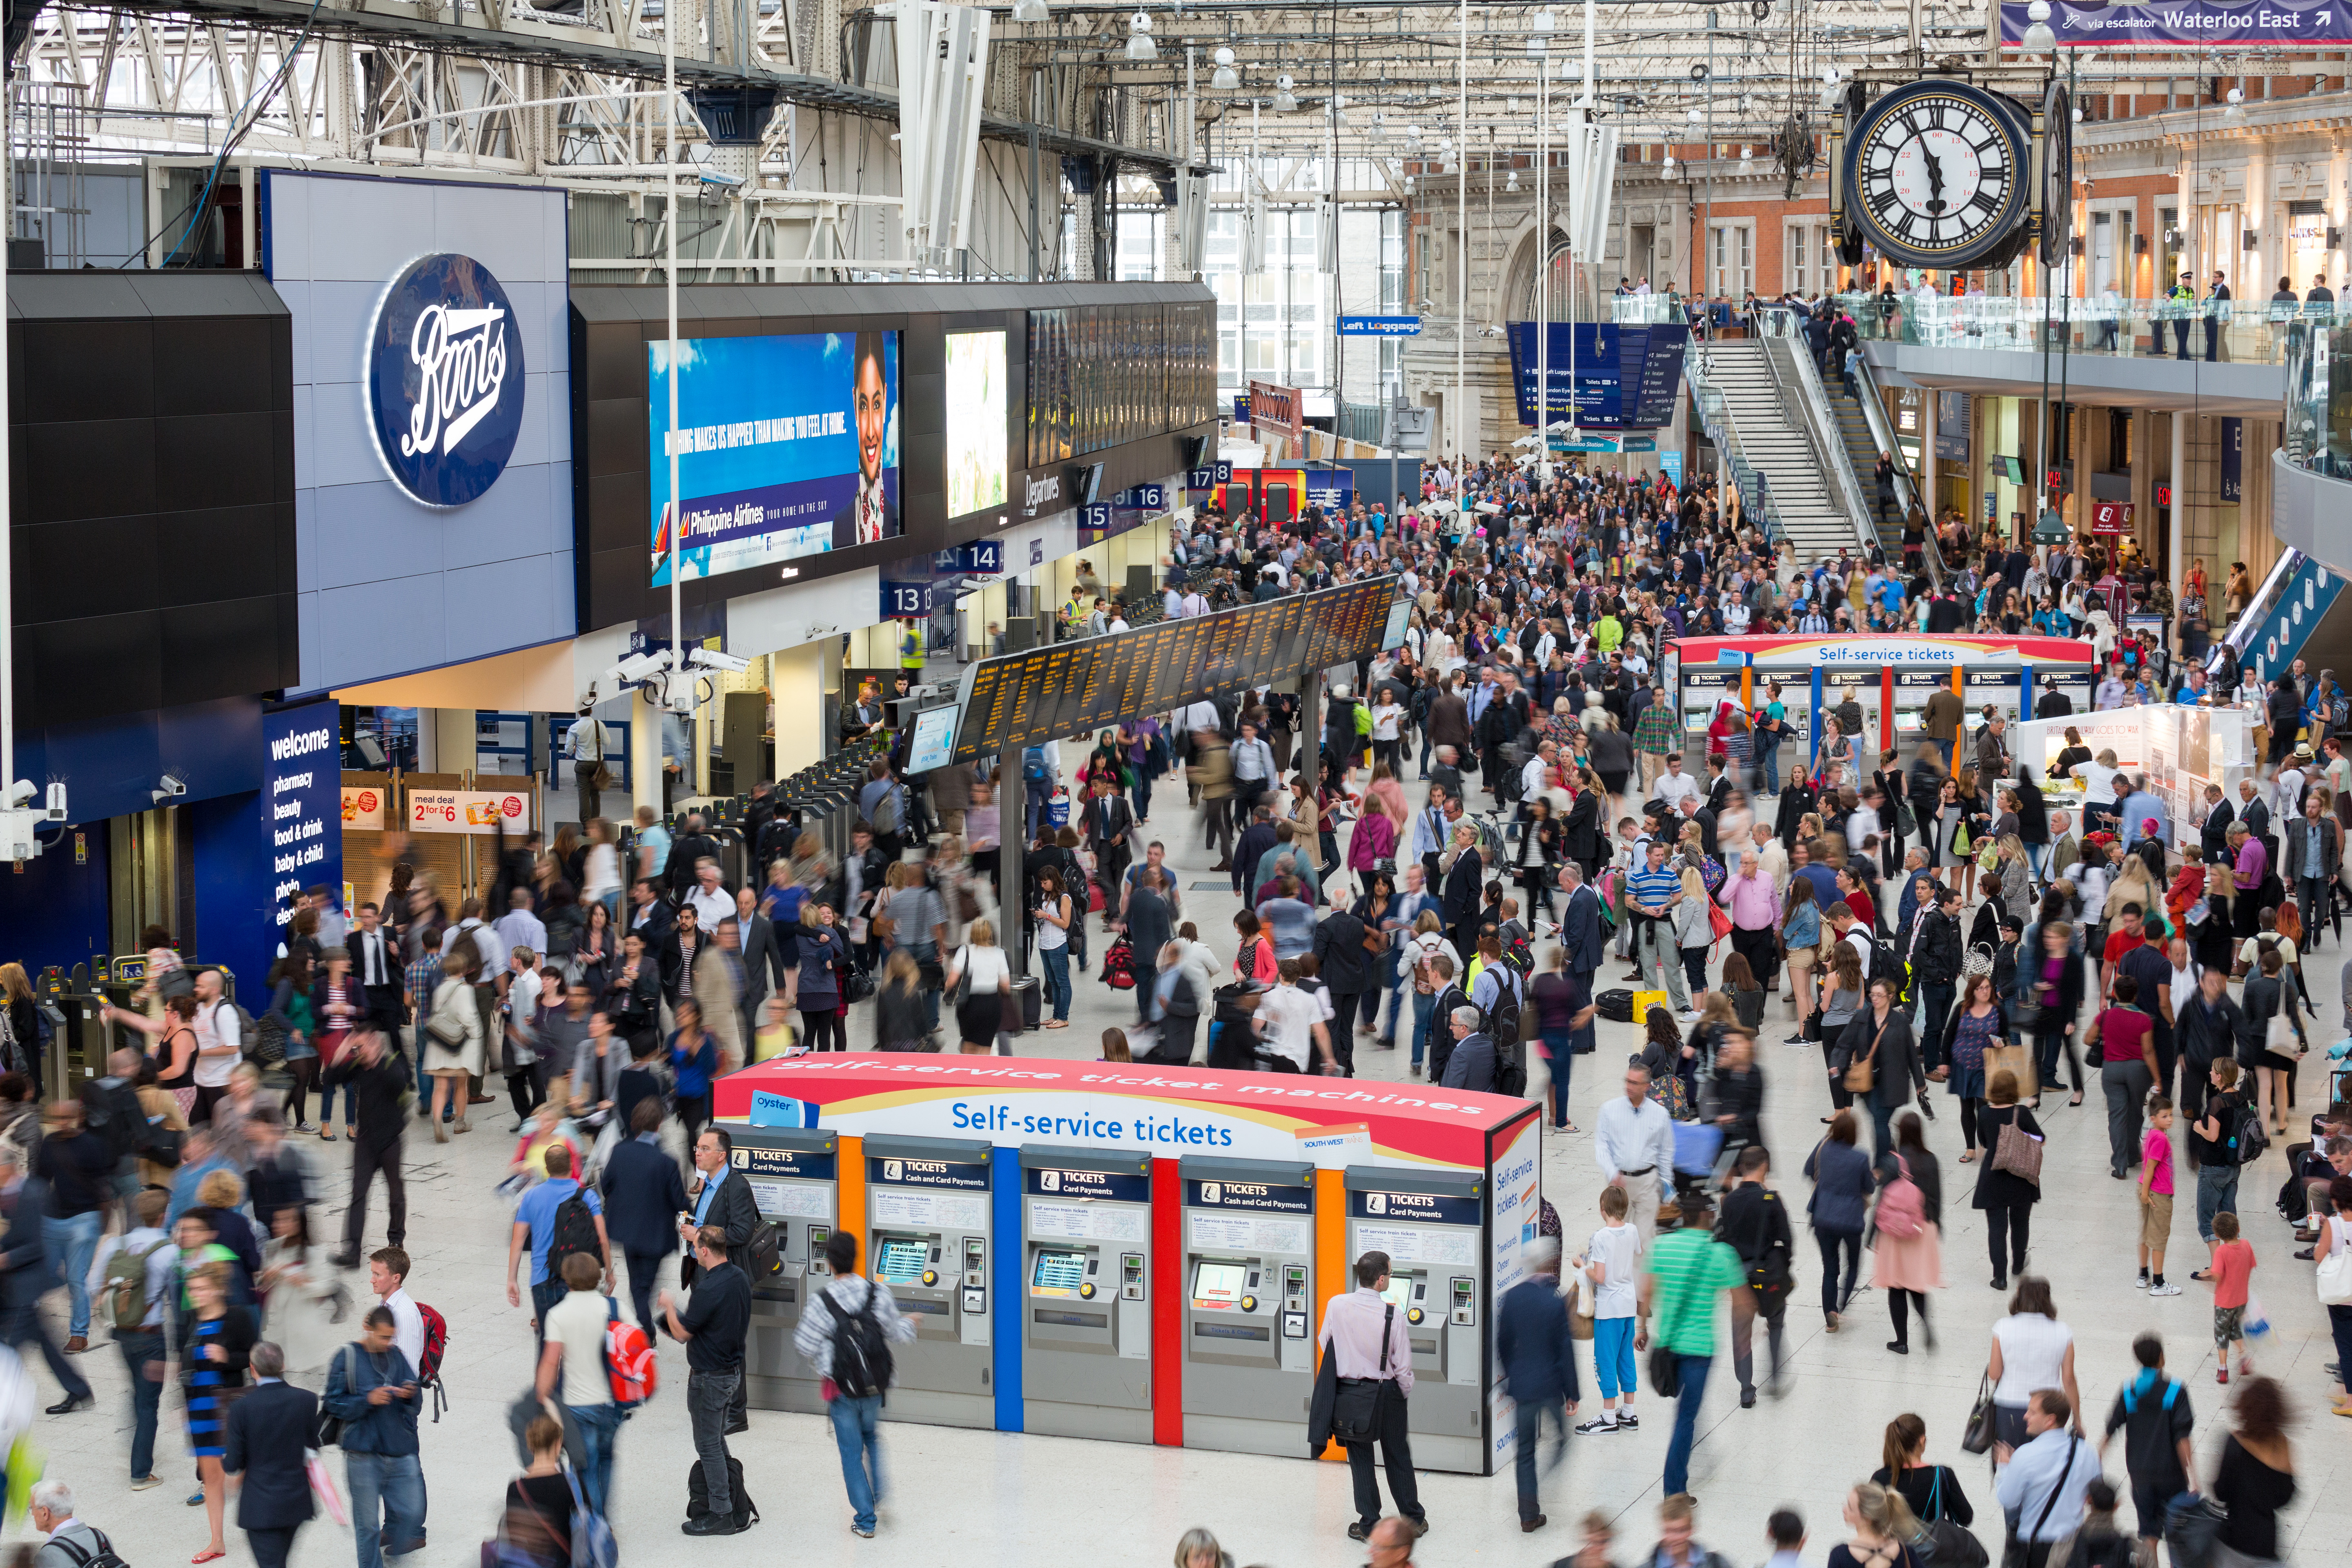
London Waterloo – Photo by Diliff; CC-BY-SA-3.0
No significant changes in the ranking with Charing Cross and Euston separated by the odd 10,000 people here and there. As the local area undergoes further re-development, Stratford knocks Leeds out of the top 10 by jumping up 2 places. (We’ll talk a bit more about that later).
Least Used
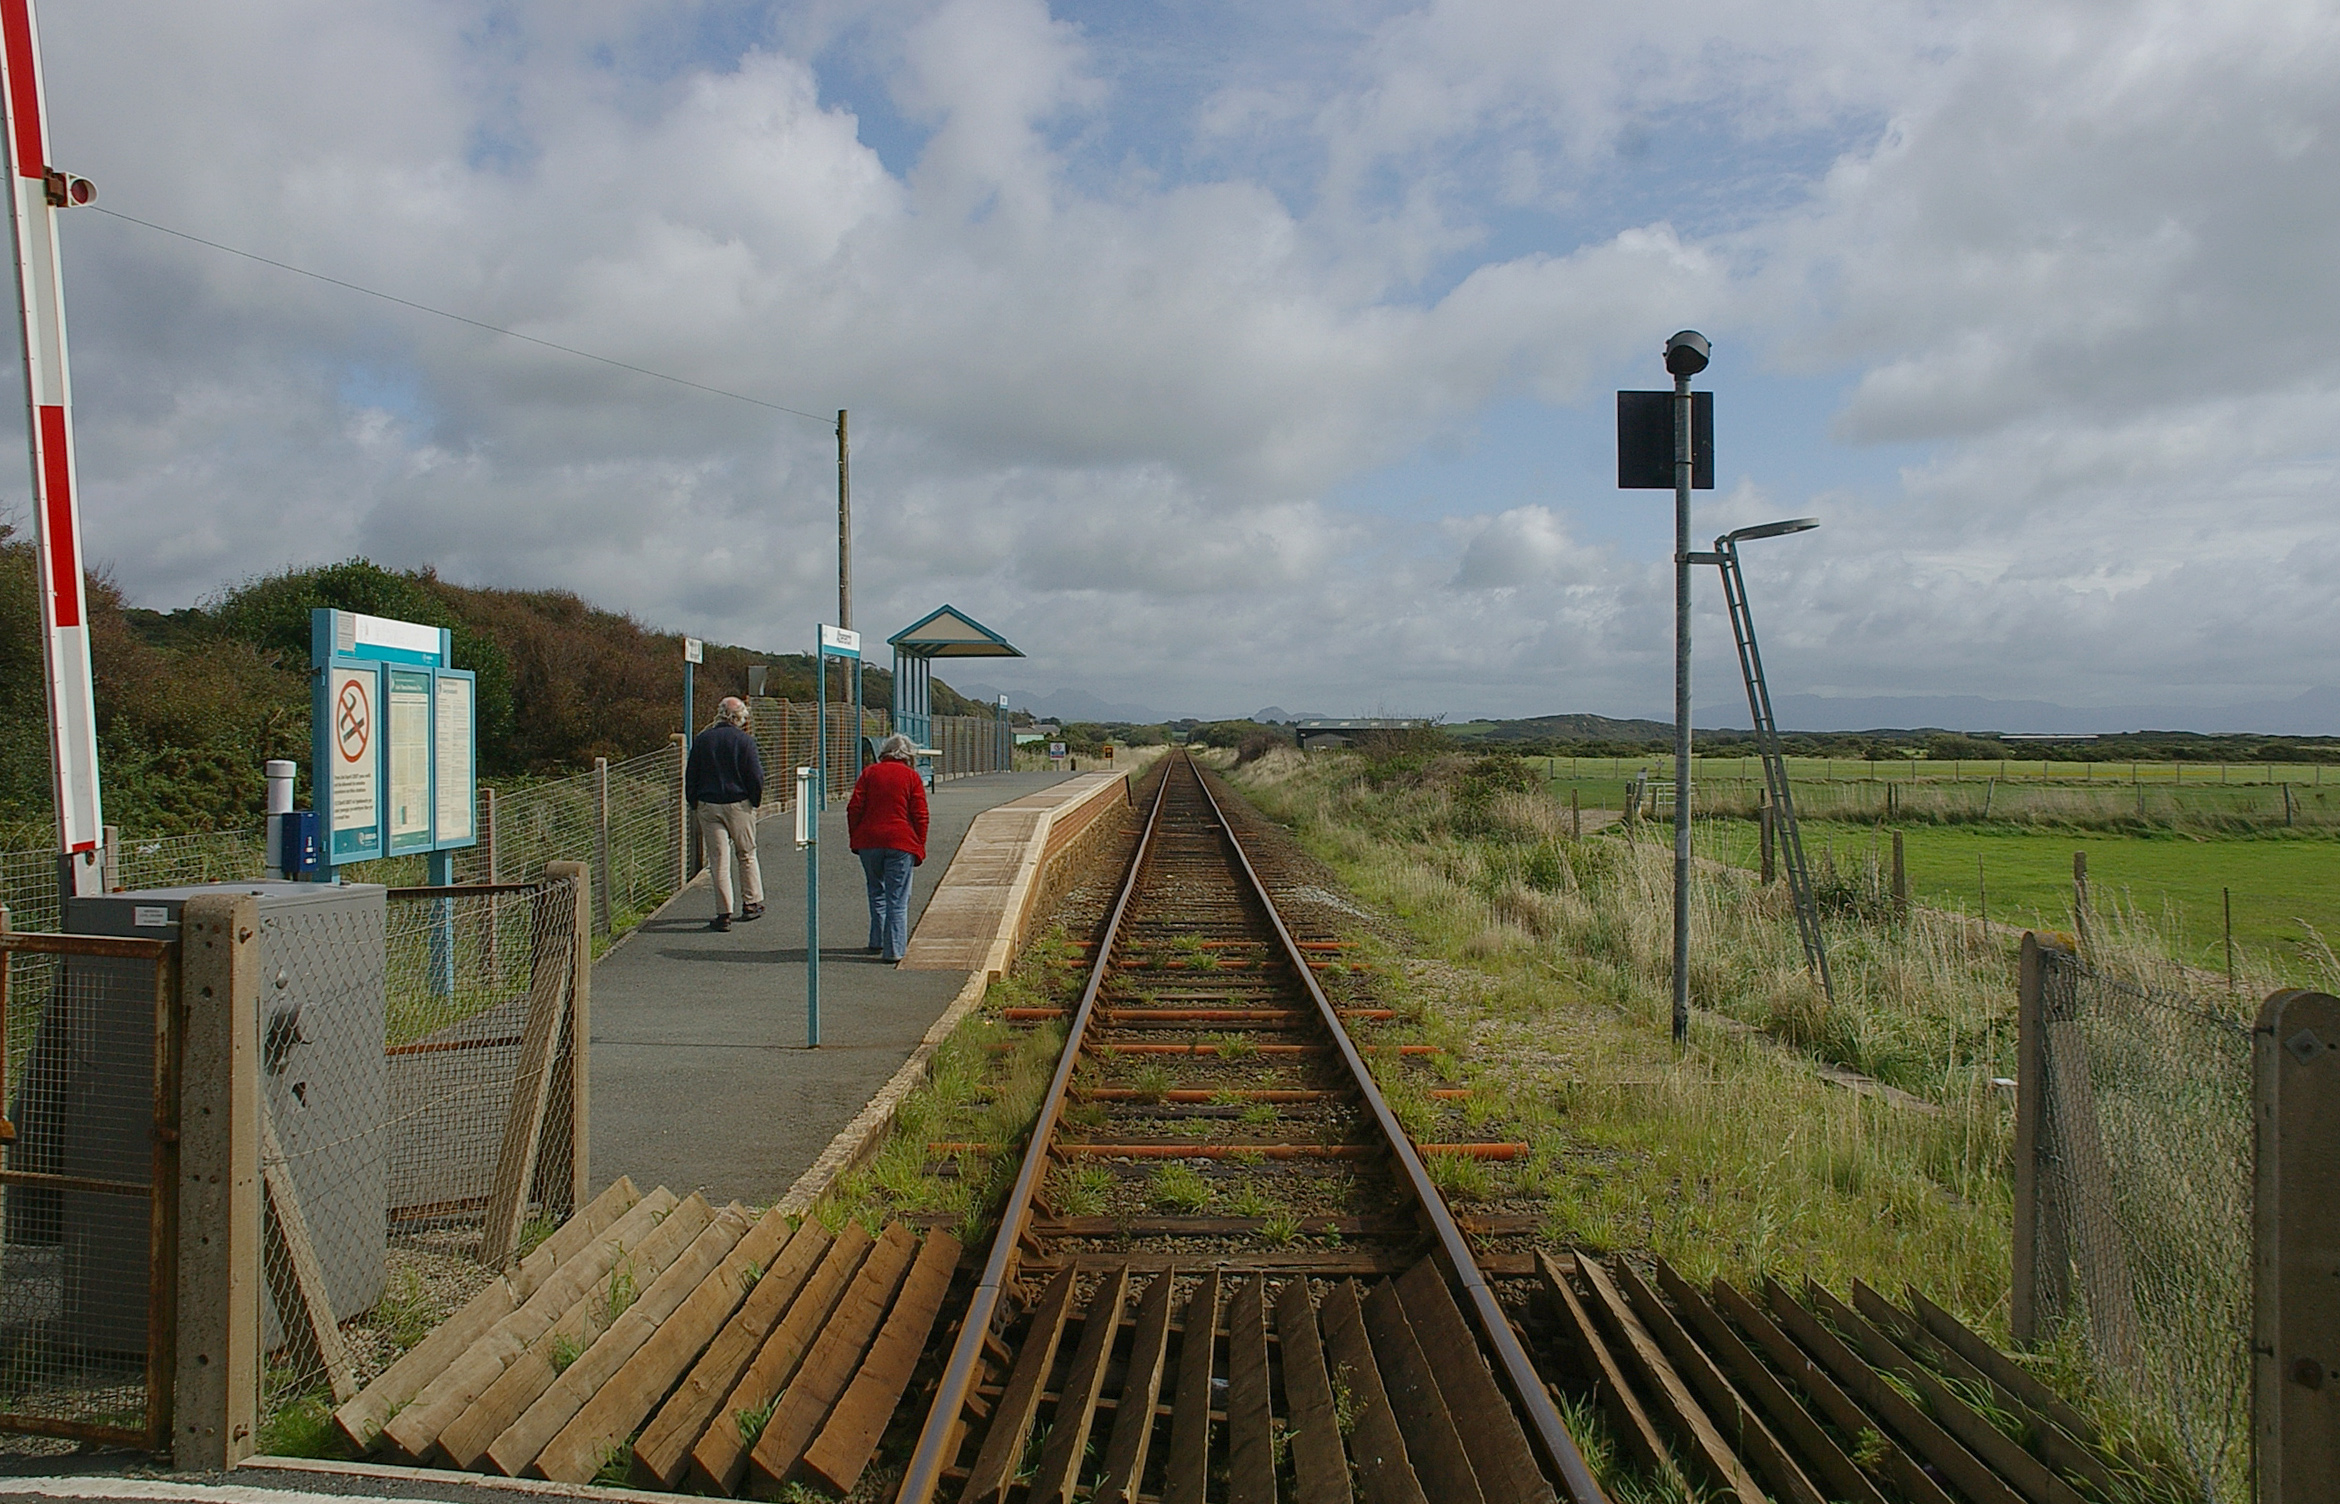
If 9/10 of the busiest stations in the UK are in London it seems logical that 10 of the least used stations aren’t**. Spread out across the country (although interestingly none in Wales) the top 10 quietest stations range from Coombe in rural Cornwall to Breich in Scotland. There’s a bit more movement in the Least Used top 10 as the margins that separate total passenger numbers are obviously much smaller. Nonetheless the stations in this list tend to interchange ranks with each other every year. The only station that didn’t appear last year is Elton & Orston, which rose 7 places in the rankings. The Nottinghamshire entry, which replaces Denton – Manchester, has seen steady decline in usage over the last 10 years. In 2014 there was a peak in usage which saw the station drop out of the top 10. The explanation for this is unclear.
**London doesn’t make the list until Rank No. 333 where the capital’s least used station, Sudbury & Harrow Road, has a comparatively massive 19,124 yearly journeys.

Shippea Hill – Photo by Mark Hurn; CC-BY-SA-2.0
The reasons for such poor passenger footfall vary. The remote locations of some of the Scottish entries naturally produce a low yield in usage despite some of these stations having a reasonable level of service. Others in more densely populated areas such as Reddish South deliberately have such poor levels of service that passengers are actively discouraged to use them. Infrequent and inconvenient services are ran – often only once a week, in one direction and very early in the morning. These bare minimum ‘Parliamentary Services’ allow Train Operating Companies to wilfully neglect stations on non-main line routes without legally having to close the station – an expensive and lengthy procedure.
This creates a rather sadly self fulfilling prophecy. Poor passenger numbers don’t attract investment and services. Poor services don’t attract passengers… and so on… In the instance of Reddish South the figures of usage are somewhat false as these erratic services attract rail enthusiasts that wouldn’t otherwise frequent the station in normal circumstances. It’s quite possible that without this unusual form of tourism most of the stations on the above list would have no yearly passengers at all.
Biggest Increase (Raw)
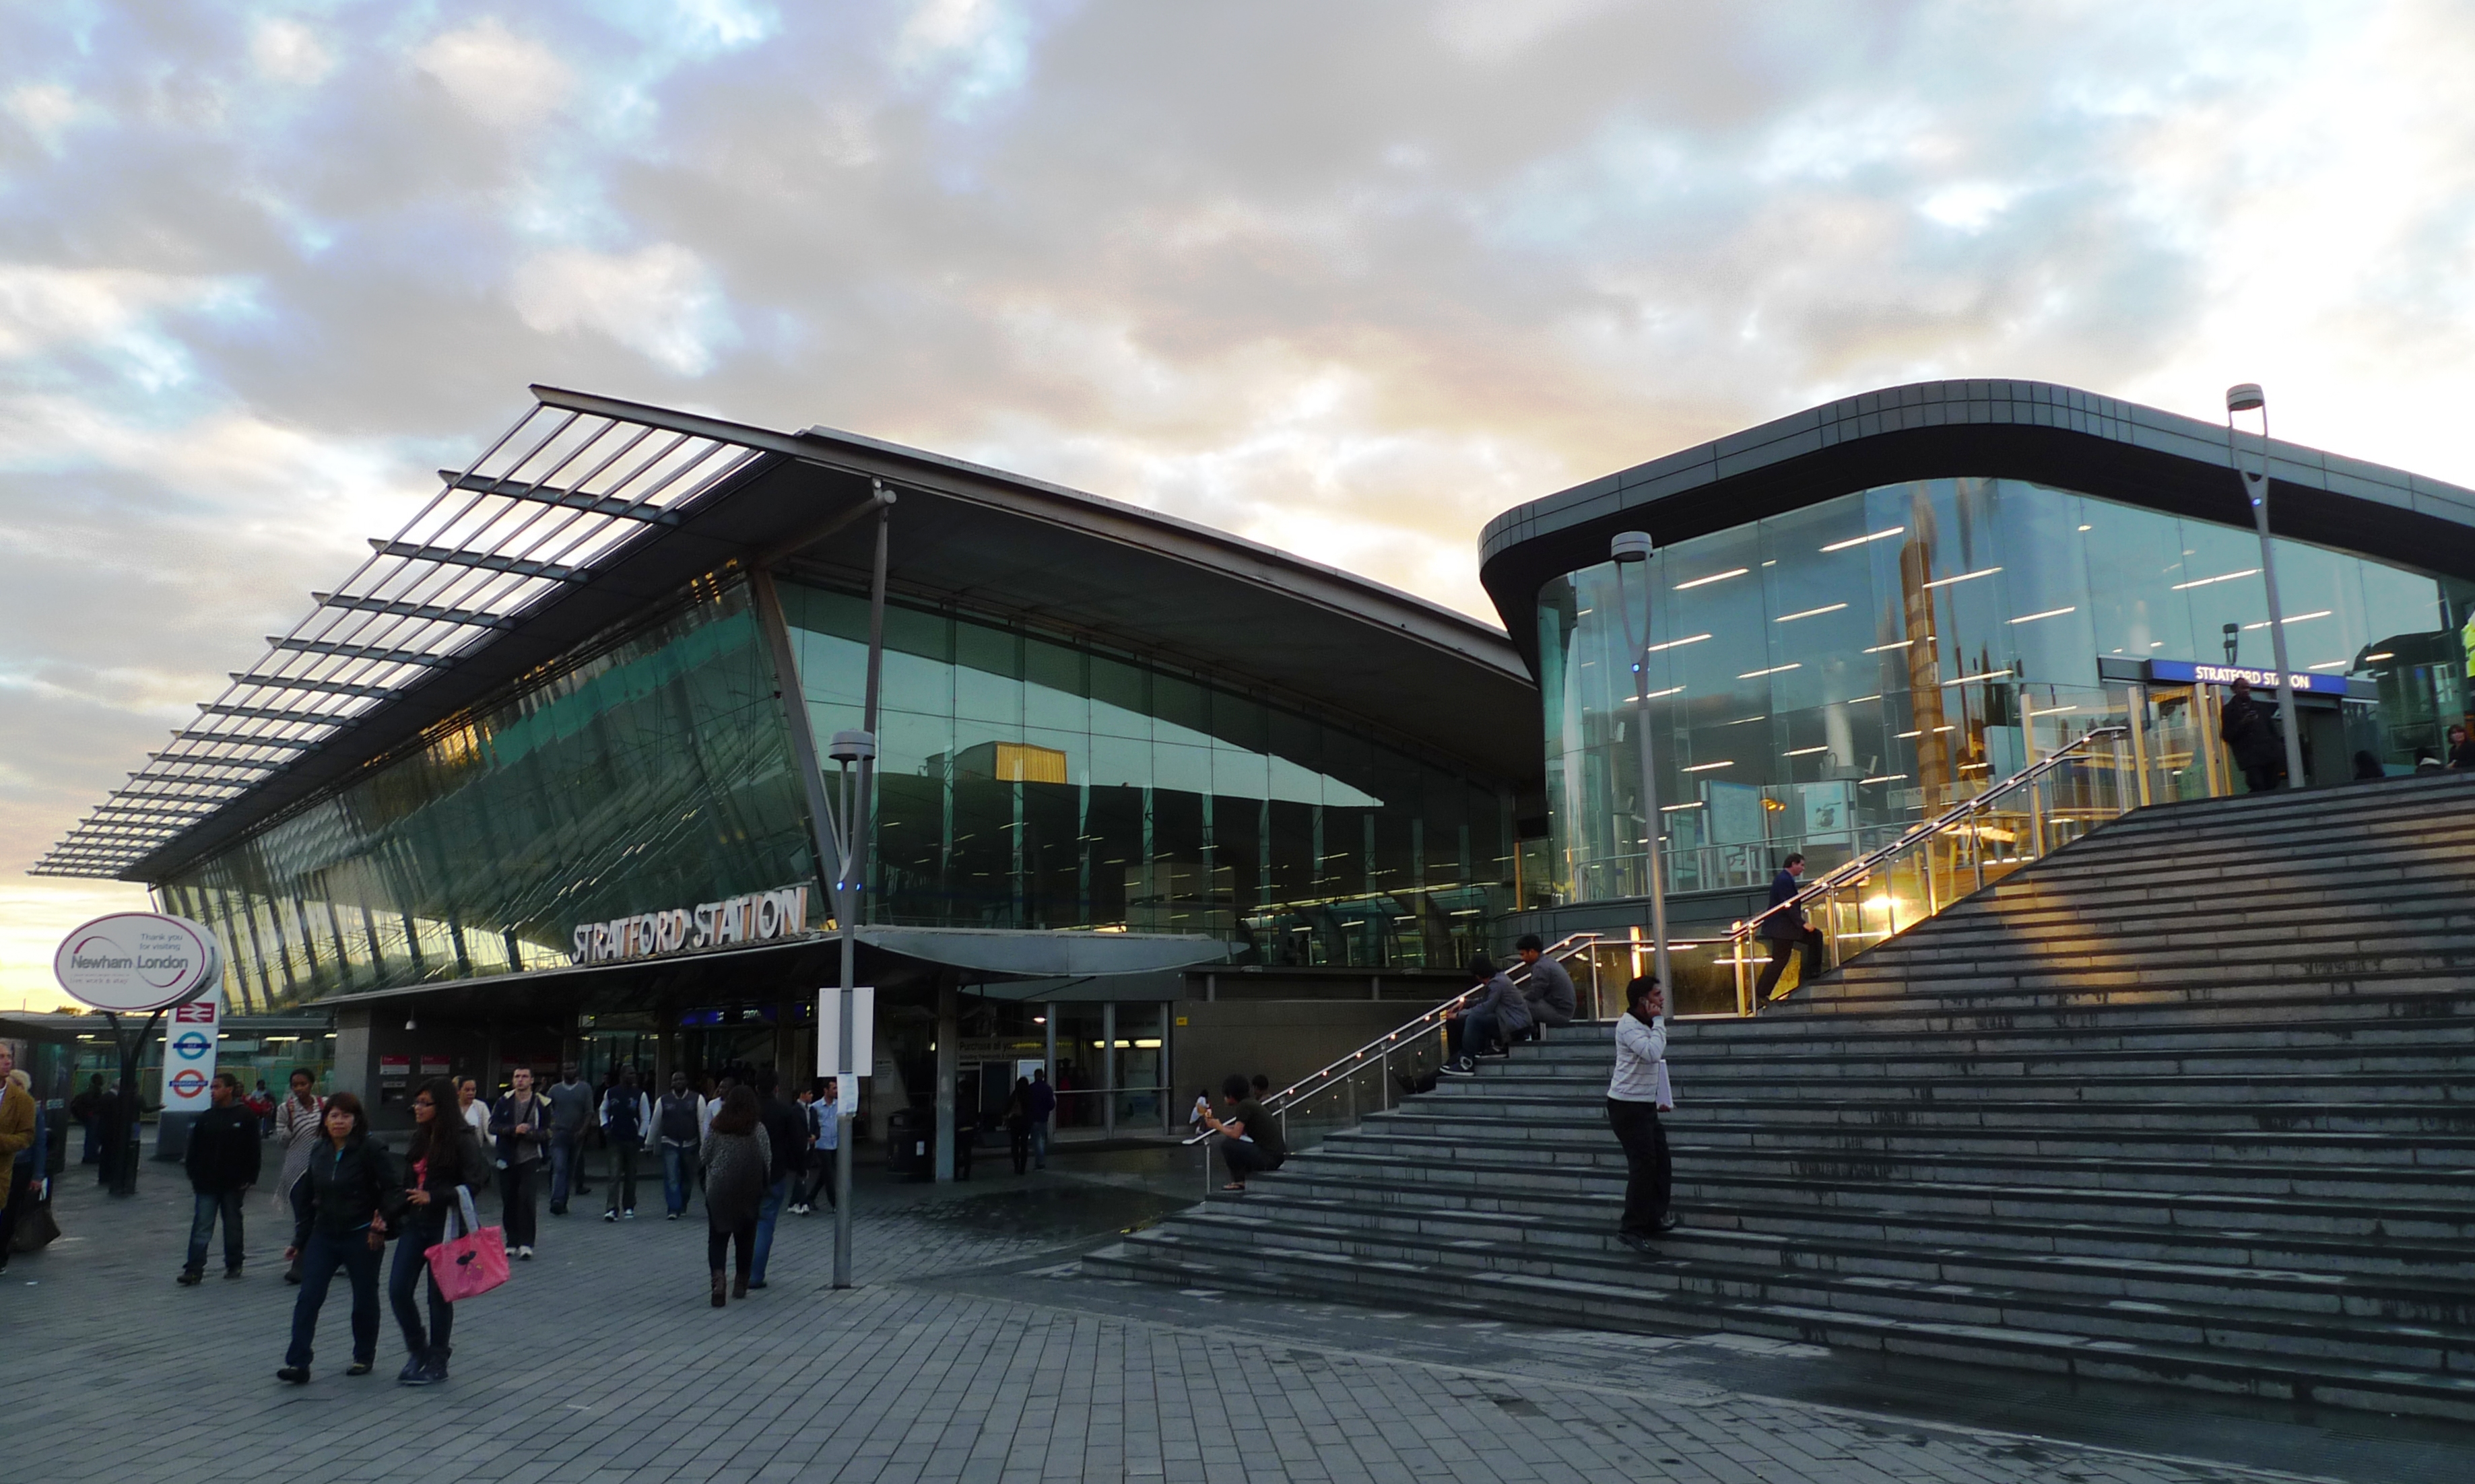
Stratford – Photo by Ewan Munro; CC-BY-SA-2.0
There are two methods of viewing changing passenger levels: Actual raw number of extra/fewer passengers, or, a percentage change with reference to the previous yaer. Both have merits and pitfuls in terms of data return. Let’s first look at the raw figures.
|
Station |
Region |
Passenger
Increase |
| 1 |
Stratford |
London |
4,596,698 |
| 2 |
Highbury & Islington |
London |
4,135,504 |
| 3 |
Canada Water |
London |
4,116,752 |
| 4 |
London Victoria |
London |
3,981,666 |
| 5 |
London Charing Cross |
London |
2,808,816 |
| 6 |
Whitechapel |
London |
2,764,794 |
| 7 |
London St. Pancras |
London |
2,195,848 |
| 8 |
Glasgow Central |
Scotland |
1,812,066 |
| 9 |
Vauxhall |
London |
1,709,700 |
| 10 |
West Ham |
London |
1,618,730 |
It’s no surprise that we return to London for large increases in passenger numbers. Some of the above list correspond with the evolution of popular London Overground services in the capital. Whilst Stratford’s astronomic increase in usership does correspond to the re-generation in the area, the original report does come with a caveat that Pay As You Go Oyster figures may have been underestimated in the previous year. This also applies to Highbury, Canada Water, Whitechapel and West Ham.
Leeds, Edinburgh and Glasgow Queen Street also feature in the top 20 with increases of over 1 million passengers each. It’s hardly shocking that in our ever congested cities rail based commuting is on the rise. The unaffordability of Central London is no doubt a contributing factor to the extra millions of people using suburban routes.
Biggest Decrease (Raw)
|
Station |
Region |
Passenger
Decrease |
| 1 |
London Bridge |
London |
-6,924,190 |
| 2 |
Southend Victoria |
East |
-2,368,108 |
| 3 |
London Fenchurch Street |
London |
-646,284 |
| 4 |
Birkenhead Hamilton Square |
North West |
-514,726 |
| 5 |
Worcester Shrub Hill |
West Midlands |
-373,432 |
| 6 |
Sunderland |
North East |
-327,634 |
| 7 |
Southend East |
East |
-239,846 |
| 8 |
Reading West |
South East |
-225,482 |
| 9 |
Newark North Gate |
East Midlands |
-207,795 |
| 10 |
Digby & Sowton |
South West |
-201,368 |
It is perhaps odd that a number of termini, especially ones in London, appear in the top 10 list of decreasing passenger numbers. Often internal factors are responsible for these figures. London Bridge for example is experiencing extensive redevelopment with many services diverted to other London termini (Incidentally this may explain increase statistics for both Charing Cross and Cannon Street). Equally Birkenhead HS was closed for the majority of the year for engineering work.

London Bridge – Photo by Sunil060902; CC-BY-SA-3.0
Reading West is likely to have seen a reversal in increasing passenger numbers due to the completion of the upgrade scheme at nearby Reading (General).
A number of stations on this list have seen changes in the way passenger figures are calculated and distributed. Southend for example would have once been grouped together under ‘Southend All’ with an estimated percentage distributed amongst Southend Victoria, Central and East. The method of data collection has now been altered to more accurately reflect true footfall from each station. Whilst Southend Victoria shows a loss of over 2 million journeys, Southend Central shows an increase of nearly 1 million. Other nearby commuter stations such as Prittlewell and Westcliffe have also seen strong increases which likely balances out the Southend area discrepancies.
Similarly Newark, Sunderland and Worcester have all seen data distribution alterations that may hamper this year’s statistics compared to last.
Fenchurch Street is a curious addition to this list, considering it is bucking the substantial rise in London termini journey figures. We can possibly attribute this to a number of days of engineering work although not on the same scale as the upgrades at London Bridge.
Overall Changes
It’s important to note that of the 2539 stations only 154 saw a drop in passenger numbers of over 10,000, most of which caused by temporary closures or engineering works.
Percentage Increase
Whilst Raw increases show important information about demand the data returned can sometimes be misleading. The increase of 4 million people at London Victoria could be considered small fry when the station was already servicing 81 million journeys. This only represents an increase of 4.9% on the year before. Under this method a small station which say doubles it’s usage would go unnoticed. It’s therefore prudent to also examine percentage increases by dividing the change in passenger numbers by last years totals.
***This list excludes Pye Corner and James Cook University Hospital as they are brand new stations for 2015 and would have returned an infinite result.
All the stations in the top 10 have managed to at least double their passenger usage in 2015. (A further 4 stations can also boast this fact). Now we’re sorting by percentage increase the capital no longer dominates the top 10. London just about makes it into the top 30 where Canada Water sits at Rank No. 29 with an increase of 66.25%.
Whilst it may appear encouraging that some stations have managed to quadruple their footfall a relative pinch of salt should be taken when digesting these values.

Energlyn & Churchill Park – Photo by Jaggery; CC-BY-SA-2.0
Energlyn & Churchill Park for example was not opened until part way through the financial year and therefore did not generate a true figure of it’s first years usage.
The stations with exceptionally poor usage that we saw earlier do not have to do much to skew the rankings. In this manner of data collection Tees-Side Airport, Britain’s 3rd least used station, can also boast that it is the 2nd most improved despite only gaining 24 more passengers. It may be asked why a station with only 6 yearly journeys suddenly gains a 300% increase in passengers, but this is likely due to it’s former status as least used station. Ironically this unusual accolade has attracted enthusiast attention which in turn has stripped it of it’s least used title.
It’s not until we get to Pevensey Bay that we see true increase which is accredited to local tourism. Manea, Blaydon and Dalmarnock are enjoying rising demand due to facility renovations and timetable adjustments. As we stated early Prittlewell and Newark appear in this list because of the change in the way data is collected for this study. Only New Lane in Lancashire has an unexplained doubling of journeys.
Percentage Decrease
At the other end of the table we again see a number of low use stations dominate the rankings. Sugar Loaf, a station that from time to time frequents the least used station list, is a good example of how a station can halve it’s footfall without dropping that many passengers in the grand scheme of things.
Abererch, Islip and Bicester were all temporarily closed in 2015 causing their numbers to understandably drop and the data redistribution at Southend Victoria we have already mentioned.
Kinbrace is flagged as having an unusual drop in passenger footfall despite steadily increasing usage for the last 10 years. A similar drop did however occur in 2010 and it recovered the following year.
It’s also worth pointing out that, with the exception of Southend Victoria, all the stations with the largest decrease of actual passengers have now vanished from this list. Despite the upgrade work at London Bridge displacing nearly 7 million passengers, it still only represents a 12.3% drop (Rank No. 110) in usage for the London terminus. This highlights the importance of examining both increases/decreases in terms of raw passenger numbers and as relative percentages.
Other Statistics
| Total Passengers Carried In UK 14/15**** |
1,392,535,310 |
Total Extra Passengers Carried
Compared To 13/14**** |
59,833,844 |
Total Extra Passengers
As Percentage Increase**** |
4.49% |
| Station With Lowest Raw Change |
Bearley
(2 extra journeys) |
| Station With Most Estimated Interchanges |
Clapham Junction
(28,425,609) |
| Most Popular Season Ticket Destination |
London Waterloo
(25,567,013) |
| Least Popular Season Ticket Destination(s)***** |
Combe, Buckenham
(1 each) |
****References Entries Into The System Only.
*****A further 127 station have No Season Ticket usage at all. Note: That is Combe, Oxfordshire not Coombe, Cornwall.
To Read the full ORR stats report click here.
References: Estimates Of Station Usage 2014/15
Photo Credits: Mattbuck, Jaggery, Sunil060902, Ewan Munro, Diliff, Mark Hurn. Cover Image by Diliff
– Andy Carter


